Examples: Heatmaps
imgaug offers support for heatmap-like data. This can be used e.g. for
depth map or keypoint/landmark localization maps. Heatmaps can be augmented
correspondingly to images, e.g. if an image is rotated by 45°, the
corresponding heatmap for that image will also be rotated by 45°.
Note:
- Heatmaps have to be bounded within value ranges, e.g.
0.0to1.0for keypoint localization maps or something like0.0to200.0(meters) for depth maps. Choosing arbitrarily low/high min/max values for unbounded heatmaps is not recommended as it could lead to numerical inaccuracies.- All augmentation functions for heatmaps are implemented under the assumption of augmenting ground truth data. As such, heatmaps will be affected by augmentations that change the geometry of images (e.g. affine transformations, cropping, resizing), but not by other augmentations (e.g. gaussian noise, saturation changes, grayscaling, dropout, …).
Features of the library’s heatmap support:
- Represent heatmaps as objects (
imgaug.augmentables.heatmaps.HeatmapsOnImage).- Augment heatmaps (only geometry-affecting augmentations, e.g. affine transformations, cropping, …).
- Use different resolutions for heatmaps than for images (e.g.
32x32heatmaps for256x256images).- Draw heatmaps – on their own or on images (
HeatmapsOnImage.draw(),HeatmapsOnImage.draw_on_image()).- Resize, average pool or max pool heatmaps (
HeatmapsOnImage.scale(),HeatmapsOnImage.avg_pool(),HeatmapsOnImage.max_pool()).- Pad heatmaps by pixel amounts or to desired aspect ratios (
HeatmapsOnImage.pad(),HeatmapsOnImage.pad_to_aspect_ratio()).
Notebook
A jupyter notebook for heatmap augmentation is available at Jupyter Notebooks. The notebooks are usually more up to date and contain more examples than the ReadTheDocs documentation.
A simple example
The following example loads a standard image and a generates a corresponding heatmap. The heatmap is supposed to be a depth map, i.e. is supposed to resemble the depth of objects in the image, where higher values indicate that objects are further away. (For simplicity we just use a simple gradient as a depth map with a cross in the center, so there is no real correspondence between the image and the depth values.)
This example shows:
- Creating heatmaps via
HeatmapsOnImage(heatmap_array, shape=image_shape).- Using value ranges outside of simple
0.0to1.0(here0.0to50.0) by settingmin_valueandmax_valuein theHeatmapsOnImagecontructor.- Resizing heatmaps, here via
HeatmapsOnImage.avg_pool(kernel_size)(i.e. average pooling).- Augmenting heatmaps via
Augmenter.__call__(), which is equivalent toAugmenter.augment().- Drawing heatmaps as overlays over images
HeatmapsOnImage.draw_on_image(image).- Drawing heatmaps on their own via
HeatmapsOnImage.draw()in jet color map or viaHeatmapsOnImage.draw(cmap=None)as intensity maps.
import imageio
import numpy as np
import imgaug as ia
import imgaug.augmenters as iaa
from imgaug.augmentables.heatmaps import HeatmapsOnImage

ia.seed(1)

# Load an example image (uint8, 128x128x3).
image = ia.quokka(size=(128, 128), extract="square")

# Create an example depth map (float32, 128x128).
# Here, we use a simple gradient that has low values (around 0.0)
# towards the left of the image and high values (around 50.0)
# towards the right. This is obviously a very unrealistic depth
# map, but makes the example easier.
depth = np.linspace(0, 50, 128).astype(np.float32)  # 128 values from 0.0 to 50.0
depth = np.tile(depth.reshape(1, 128), (128, 1))    # change to a horizontal gradient

# We add a cross to the center of the depth map, so that we can more
# easily see the effects of augmentations.
depth[64-2:64+2, 16:128-16] = 0.75 * 50.0  # line from left to right
depth[16:128-16, 64-2:64+2] = 1.0 * 50.0   # line from top to bottom

# Convert our numpy array depth map to a heatmap object.
# We have to add the shape of the underlying image, as that is necessary
# for some augmentations.
depth = HeatmapsOnImage(
    depth, shape=image.shape, min_value=0.0, max_value=50.0)

# To save some computation time, we want our models to perform downscaling
# and hence need the ground truth depth maps to be at a resolution of
# 64x64 instead of the 128x128 of the input image.
# Here, we use simple average pooling to perform the downscaling.
depth = depth.avg_pool(2)

# Define our augmentation pipeline.
seq = iaa.Sequential([
    iaa.Dropout([0.05, 0.2]),      # drop 5% or 20% of all pixels
    iaa.Sharpen((0.0, 1.0)),       # sharpen the image
    iaa.Affine(rotate=(-45, 45)),  # rotate by -45 to 45 degrees (affects heatmaps)
    iaa.ElasticTransformation(alpha=50, sigma=5)  # apply water effect (affects heatmaps)
], random_order=True)

# Augment images and heatmaps.
images_aug = []
heatmaps_aug = []
for _ in range(5):
    images_aug_i, heatmaps_aug_i = seq(image=image, heatmaps=depth)
    images_aug.append(images_aug_i)
    heatmaps_aug.append(heatmaps_aug_i)

# We want to generate an image of original input images and heatmaps
# before/after augmentation.
# It is supposed to have five columns:
# (1) original image,
# (2) augmented image,
# (3) augmented heatmap on top of augmented image,
# (4) augmented heatmap on its own in jet color map,
# (5) augmented heatmap on its own in intensity colormap.
# We now generate the cells of these columns.
#
# Note that we add a [0] after each heatmap draw command. That's because
# the heatmaps object can contain many sub-heatmaps and hence we draw
# command returns a list of drawn sub-heatmaps.
# We only used one sub-heatmap, so our lists always have one entry.
cells = []
for image_aug, heatmap_aug in zip(images_aug, heatmaps_aug):
    cells.append(image)                                                     # column 1
    cells.append(image_aug)                                                 # column 2
    cells.append(heatmap_aug.draw_on_image(image_aug)[0])                   # column 3
    cells.append(heatmap_aug.draw(size=image_aug.shape[:2])[0])             # column 4
    cells.append(heatmap_aug.draw(size=image_aug.shape[:2], cmap=None)[0])  # column 5

# Convert cells to grid image and save.
grid_image = ia.draw_grid(cells, cols=5)
imageio.imwrite("example_heatmaps.jpg", grid_image)
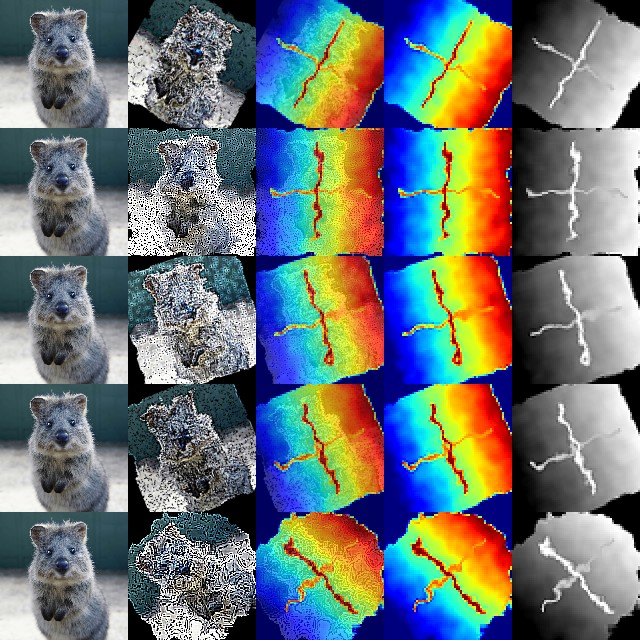
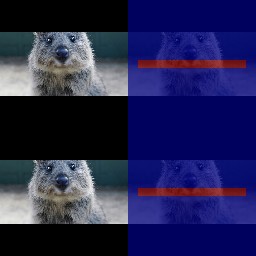
Results of the above example code. Columns show: (1) Original image, (2) augmented image, (3) augmented heatmap overlayed with augmented image, (4) augmented heatmap alone in jet color map, (5) augmented heatmap alone as intensity map.
Multiple sub-heatmaps per heatmaps object
The above example augmented a single heatmap with shape (H, W) for the
example image. If you want to augment more heatmaps per image, you can simply
extend the heatmap array’s shape to (H, W, C), where C is the number
of heatmaps. The following example instantiates one heatmap object containing
three sub-heatmaps and draws them onto the image. Heatmap augmentation would
be done in the exactly same way as in the previous example.
import imageio
import numpy as np
import imgaug as ia
from imgaug.augmentables.heatmaps import HeatmapsOnImage

# Load an image and generate a heatmap array with three sub-heatmaps.
# Each sub-heatmap contains just three horizontal lines, with one of them
# having a higher value (1.0) than the other two (0.2).
image = ia.quokka(size=(128, 128), extract="square")
heatmap = np.zeros((128, 128, 3), dtype=np.float32)
for i in range(3):
    heatmap[1*30-5:1*30+5, 10:-10, i] = 1.0 if i == 0 else 0.5
    heatmap[2*30-5:2*30+5, 10:-10, i] = 1.0 if i == 1 else 0.5
    heatmap[3*30-5:3*30+5, 10:-10, i] = 1.0 if i == 2 else 0.5
heatmap = HeatmapsOnImage(heatmap, shape=image.shape)

# Draw image and the three sub-heatmaps on it.
# We draw four columns: (1) image, (2-4) heatmaps one to three drawn on
# top of the image.
subheatmaps_drawn = heatmap.draw_on_image(image)
cells = [image, subheatmaps_drawn[0], subheatmaps_drawn[1],
         subheatmaps_drawn[2]]
grid_image = np.hstack(cells)  # Horizontally stack the images
imageio.imwrite("example_multiple_heatmaps.jpg", grid_image)
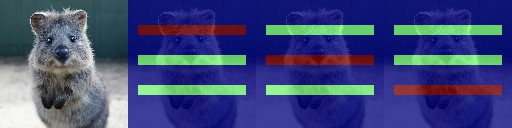
Results of the above example code. It shows the original image with three
heatmaps. The three heatmaps were combined in one HeatmapsOnImage
object.
Accessing the heatmap array
After augmentation you probably want to access the heatmap’s numpy array.
This is done using the function HeatmapsOnImage.get_arr(). That functions
output shape will match your original heatmap array’s shape, i.e. either
(H, W) or (H, W, C). The below code shows an example, where that
function’s result is changed and then used to instantiate a new
HeatmapsOnImage object.
Alternatively you could also change the heatmap object’s internal array, saved
as HeatmapsOnImage.arr_0to1. As the name indicates, it is always normalized
to the range 0.0 to 1.0, while get_arr() reverses that
normalization. It has also always shape (H, W, C), with C>=1.
import imageio
import numpy as np
import imgaug as ia
from imgaug.augmentables.heatmaps import HeatmapsOnImage

# Load an image and generate a heatmap array containing one horizontal line.
image = ia.quokka(size=(128, 128), extract="square")
heatmap = np.zeros((128, 128, 1), dtype=np.float32)
heatmap[64-4:64+4, 10:-10, 0] = 1.0
heatmap1 = HeatmapsOnImage(heatmap, shape=image.shape)

# Extract the heatmap array from the heatmap object, change it and create
# a second heatmap.
arr = heatmap1.get_arr()
arr[10:-10, 64-4:64+4] = 0.5
heatmap2 = HeatmapsOnImage(arr, shape=image.shape)

# Draw image and heatmaps before/after changing the array.
# We draw three columns:
# (1) original image,
# (2) heatmap drawn on image,
# (3) heatmap drawn on image, with some changes made to the heatmap array.
cells = [image,
         heatmap1.draw_on_image(image)[0],
         heatmap2.draw_on_image(image)[0]]
grid_image = np.hstack(cells)  # Horizontally stack the images
imageio.imwrite("example_heatmaps_arr.jpg", grid_image)
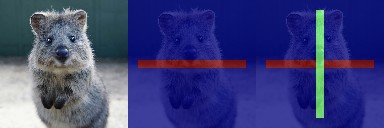
Results of the above example code. It shows the original image, a corresponding heatmap and again the same heatmap after its array was read out and changed.
Resizing heatmaps
When working with heatmaps it is common that the size of the input images and
the heatmap sizes don’t match or are supposed to not match (e.g. because
predicted network output are of low resolution). HeatmapsOnImage offers
several functions to deal with such situations:
HeatmapsOnImage.avg_pool(kernel_size) applies average pooling to images,
HeatmapsOnImage.max_pool(kernel_size) analogously max pooling and
HeatmapsOnImage.resize(size, [interpolation]) performs resizing. For the
pooling functions the kernel size is expected to be a single integer or a
tuple of two/three entries (size along each dimension). For resize, the
size is expected to be a (height, width) tuple and interpolation can
be one of the strings nearest (nearest neighbour interpolation), linear,
cubic (default) or area.
The below code shows an example. It instantiates a simple 128x128 heatmap
with two horizontal lines (one of which is blurred) and a small square in the
center. It then applies average pooling, max pooling and resizing to heatmap
sizes 64x64, 32x32 and 16x16. Then, an output image is generated
with six rows: The first three show the results of average/max pooling and
resizing, while the rows three to six show the same results after again
resizing them to 128x128 using nearest neighbour upscaling.
import imageio
import numpy as np
import imgaug as ia
import imgaug.augmenters as iaa
from imgaug.augmentables.heatmaps import HeatmapsOnImage


def pad_by(image, amount):
    return ia.pad(image,
                  top=amount, right=amount, bottom=amount, left=amount)

def draw_heatmaps(heatmaps, upscale=False):
    drawn = []
    for heatmap in heatmaps:
        if upscale:
            drawn.append(
                heatmap.resize((128, 128), interpolation="nearest")
                       .draw()[0]
            )
        else:
            size = heatmap.get_arr().shape[0]
            pad_amount = (128-size)//2
            drawn.append(pad_by(heatmap.draw()[0], pad_amount))
    return drawn

# Generate an example heatmap with two horizontal lines (first one blurry,
# second not) and a small square.
heatmap = np.zeros((128, 128, 1), dtype=np.float32)
heatmap[32-4:32+4, 10:-10, 0] = 1.0
heatmap = iaa.GaussianBlur(3.0).augment_image(heatmap)
heatmap[96-4:96+4, 10:-10, 0] = 1.0
heatmap[64-2:64+2, 64-2:64+2, 0] = 1.0
heatmap = HeatmapsOnImage(heatmap, shape=(128, 128, 1))

# Scale the heatmaps using average pooling, max pooling and resizing with
# default interpolation (cubic).
avg_pooled = [heatmap, heatmap.avg_pool(2), heatmap.avg_pool(4),
              heatmap.avg_pool(8)]
max_pooled = [heatmap, heatmap.max_pool(2), heatmap.max_pool(4),
              heatmap.max_pool(8)]
resized = [heatmap, heatmap.resize((64, 64)), heatmap.resize((32, 32)),
           heatmap.resize((16, 16))]

# Draw an image of all scaled heatmaps.
cells = draw_heatmaps(avg_pooled)\
    + draw_heatmaps(max_pooled)\
    + draw_heatmaps(resized)\
    + draw_heatmaps(avg_pooled, upscale=True)\
    + draw_heatmaps(max_pooled, upscale=True)\
    + draw_heatmaps(resized, upscale=True)
grid_image = ia.draw_grid(cells, cols=4)
imageio.imwrite("example_heatmaps_scaling.jpg", grid_image)
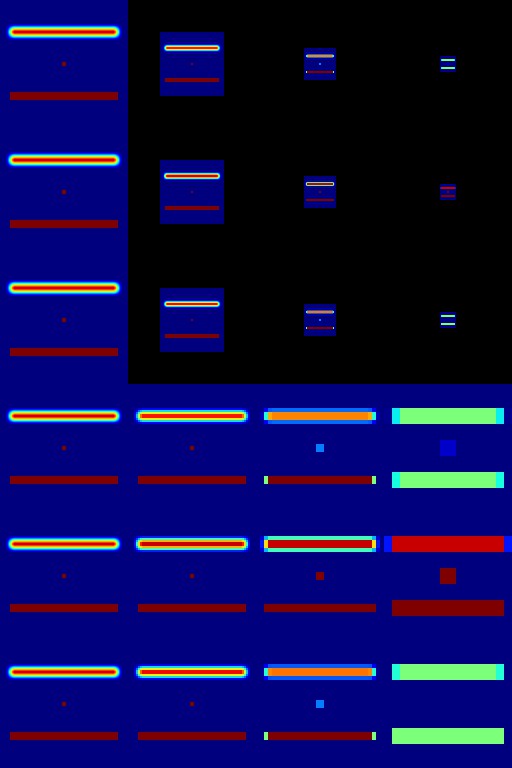
Results of the above example code. It shows six rows:
(Rows 1-3) scaling via average pooling, max pooling and (cubic) resizing
to 64x64 (column 2), 32x32 (column 3) and 16x16 (column 4) and
then zero-padding to 128x128. (Rows 4-6) Doing the same again, but
not padding to 128x128 but instead resizing using nearest neighbour
upscaling.
Padding heatmaps
Another common operation is padding of images and heatmaps, especially to
squared sizes. This is done for images using
imgaug.pad(image, [top], [right], [bottom], [left], [mode], [cval])
and imgaug.pad_to_aspect_ratio(image, aspect_ratio, [mode], [cval], [return_pad_amounts]).
For heatmaps it is done using
HeatmapsOnImage.pad([top], [right], [bottom], [left], [mode], [cval]) and
HeatmapsOnImage.pad_to_aspect_ratio(aspect_ratio, [mode], [cval], [return_pad_amounts]).
In both cases, pad() expects pixel amounts (i.e. integers) and
pad_to_aspect_ratio() the target aspect ratio, given as a float denoting
ratio = width / height (i.e. a value of 1.0 would lead to a squared
image/heatmap, while 2.0 would lead to a fairly wide image/heatmap).
The below code shows an example for padding. It starts with a squared sized image and heatmap, cuts both so that they are more wide than high and then zero-pads both back to squared size.
import imageio
import numpy as np
import imgaug as ia
from imgaug.augmentables.heatmaps import HeatmapsOnImage

# Load example image and generate example heatmap with one horizontal line
image = ia.quokka((128, 128), extract="square")
heatmap = np.zeros((128, 128, 1), dtype=np.float32)
heatmap[64-4:64+4, 10:-10, 0] = 1.0

# Cut image and heatmap so that they are no longer squared
image = image[32:-32, :, :]
heatmap = heatmap[32:-32, :, :]

heatmap = HeatmapsOnImage(heatmap, shape=(128, 128, 1))

# Pad images and heatmaps by pixel amounts or to aspect ratios
# We pad both back to squared size of 128x128
images_padded = [
    ia.pad(image, top=32, bottom=32),
    ia.pad_to_aspect_ratio(image, 1.0)
]
heatmaps_padded = [
    heatmap.pad(top=32, bottom=32),
    heatmap.pad_to_aspect_ratio(1.0)
]

# Draw an image of all padded images and heatmaps
cells = [
    images_padded[0],
    heatmaps_padded[0].draw_on_image(images_padded[0])[0],
    images_padded[1],
    heatmaps_padded[1].draw_on_image(images_padded[1])[0]
]

grid_image = ia.draw_grid(cells, cols=2)
imageio.imwrite("example_heatmaps_padding.jpg", grid_image)
Results of the above example code. It shows an input image and a heatmap
that were both first cut to 64x128 and then padded back to squared
size of 128x128. First row uses pad(), second uses
pad_to_aspect_ratio().